


The Power of Data Visualization and how it can Work for your Brand
What is data visualization?
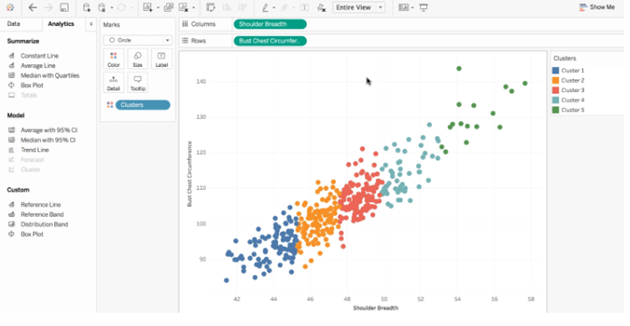
The above GIF should give a fair idea of what data visualization is all about. Data visualization is presenting data in a visual context to make its assimilation and understanding better. In the world of big data, powerful visualization tools enable deep dive into information and restructuring raw data revealing patterns, trends, and correlations.
The Power and Benefits of Data Visualization
In the current digital world any click, swipe, search, touch, user interaction and contact generates data. This copious amount of big data is unstructured and diverse but a great source of information about consumer behaviour, trends and wants. Successful businesses mine and leverage this information for their business objectives. Without data visualization, it can be a complex and trying task. Data visualization is an empowering tool to help in analytics and take data-driven decisions. Busy executives also find such presentations and communications a convenient mode to quickly grasp concepts, key issues and get pertinent insights for faster resolutions.
Data visualization gives the power to:
- Simplify complexities
- Enhance deeper understanding
- Access hidden nuances
- Focus on relevant
- Confidence in data-backed choices
- Have an interactive and immersive experience
In current data-rich times, to make sense of and see the significance of information, effective data visualization is a business imperative. A look at the following list of benefits will underline the value data visualization provides:
a. Faster and deeper absorption of business intelligence: Visuals creates a much greater impact than text. Since visualization can break up the data into smaller chunks, it becomes easier to comprehend and retain.
b. Reduces decision time: Quicker understanding of the various linkages brought out by visual representation of data enables a faster, more informed decision. This also improves the acceptance of policies and strategies by various stakeholders as it is supported by readily understood and visible underlying facts.
c. Identifies patterns and trends: Makes explicit trends and relationships between key metrics which may not be usually so apparent in non-visual data. These findings can give new insights into operational bottlenecks and sticky points that need corrective action. These hidden dimensions become easier to comprehend in visual data allowing better extrapolation.
d. Facilitates deeper interpretation: Meaningful interpretation matters taking the right decisions. Data visualization helps in unambiguous interpretations backed by visible reasoning.
e. Improves productivity and ROI: In a study by the Aberdeen group , it was found that managers in industries using visual data discovery tools are 28% more likely than their peers that just use managed reporting and dashboards to find more timely information. Some takeaways that emerged from the report--more timely access to information to more people, changing mindset, changing the dynamic of analytics delivery -- show the value proposition of data visualization. Getting timely and pertinent information leads to more productive outcomes and faster decision making.
f. Improves Communication: Getting your point across to various internal and external stakeholders, markets and media are easy and convenient thereby increasing trust and transparency.
Tools and Ways to effectively do Data Visualization
Many software transforms raw data into multiple graphical formats and presentations. Some of the currently popular tools are:
- Tableau
- Power B
- DataWrapper
- Google charts
- Fusion charts
- Sisense
- Infogram
- Qlik
- Zoho
- Domo, etc.
The above list is only illustrative and the choice of the right tool will depend on the requirement and how well the features of the respective tools match up to the need. Needless to add in absence of a specific stipulation, it is better to go for a versatile tool. The way to select the right tool could be to look at factors like ease of use, costs, integrability with existing software, customization and scalability, security and reliability, market reviews, seller reputation, after-sales customer support, etc.
Conclusion/How can PW help
Getting the right type of visualizations that suit an enterprise's analytical and business goals requires considerable skill. Utilizing expert help to assist in this exploration and implementation exercise, at the right cost, is a step in the right direction. PennyWise has expertise in data visualization tools like Tableau, Power BI, Klipfolio, Spitfire and more. They can offer customized solutions to make your brand a distinctive standout amongst peers.